A Typical Case Study
<<<<<< Page 5 / 10 >>>>>>
Having collected the data, the processing of it (whether done mannually or using a number of available commercial softwares) will give us a series of Tabular & Graphical results, presented in the following few pages,
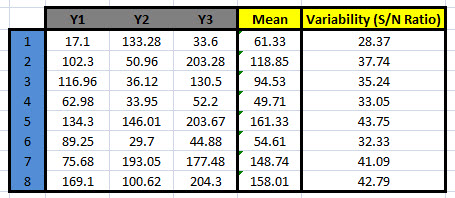
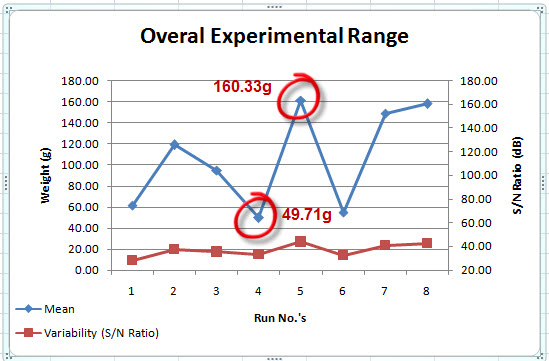
Firstly, Mean and Variability (represented by S/N Ratio here) must be calculated. Plotting of these two basic measures over the experimental range shows the overal "optimisation potential" from this experiment. A glance at the above chart reveals tha the "moulding process" under study here has the potential of delivering mean product weights of between 49.71-161.33g. It must be remembered that this statement is valid ONLY within ranges of the factors experimented in this DOE. Also, the S/N Ratio shows a range of 28.73-43.75dB. This mean a potential for optimising S/N ratio by 15dB. Every 3 dB increase in S/N ratio is approximately equivalent to 29% reduction in standard deviation. To realise these potentials, the optimium levels must be established.
|