A Typical Case Study
<<<<<< Page 7 / 10 >>>>>>
So..........How do we realise these potentials? Again, either manually or by using available DOE software, we should establish which one of the factors have a significant influence on our process output (weight in this case). This can be done graphically or through ANOVA (Analysis of Variance). Below, the main effect plot for mean is shown. For ANOVA, see next page!
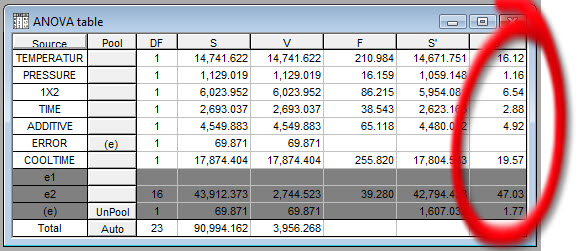
ANOVA gives the same information about the influence of factors, but with statistical significance (F-tests). It results in a %-age contribution effect beong allocated to each of the factors under study.Finally, ANOVA provides a measure regarding the success of the experimental effort. It shows in this case that 47% of the changes to the mean weight during this experiment were not EXPLAINED! There could many many explanations for this!
|